blot
Blot is a plotting library written in C, that plots data onto a string buffer.
That’s right, there are no images, just text – see examples below.
There is a C++ wrapper provided, as well as a CLI tool.
Site: bartman.github.io/blot
GitHub: github.com/bartman/blot
Copyright © 2021-2025 Bart Trojanowski
Licensed under LGPL v2.1, or any later version.
Noteworthy features
- plots to the console as text (by calling
puts()/printf()) - very very fast (compared to python alternatives)
- very very memory usage friendly
- can plot multiple datasets on one canvas
- uses familiar figure based API (similar to existing python plotting frameworks)
- supports braille plotting (like plotille)
- data arrays can be provided in various types (
int16,int32,int64,double, orfloat) - there is a C++ wrapper, with limited features, for convenience
- there is a CLI tool that can plot from files or using output of commands
Prerequisites
blot is developed on NixOS and Debian, and CI tested on Debian and Ubuntu.
It is built using standard tools. The dependency script will install the
required packages if you’re on a Debian-based distro.
./dependencies.sh
Packages that blot needs: make ninja cmake glib2 googletest.
Building
blot is built using cmake and ninja. There is a top level Makefile only to
simplify the build process (it invokes cmake in the build subdirectory).
make
You can build debug (with ASAN) using
make TYPE=Debug
Run make help for a full list.
blot CLI
The easiest say to use blot is to use the CLI, which is able to read from files
or launch programs, then plot the numbers it finds.
See the online help for a full list of features…
❯ blot --help
SYNOPSIS
    blot [-h] [-V]
    blot [-v] [--debug] [--timing] [-i <sec>] [-A|-U|-B] ((scatter|line|bar)
         ([-R <file>] | [-F <file>] | [-P <file>] | [-X <cmd>] | [-W <cmd>])
         [-p <y-pos|x-pos,y-pos>] [-r <regex>] [-l <count>] [-c <color>] [-i <sec>])...

OPTIONS
    -h, --help                  This help
    -V, --version               Version

    Run modifiers:
        -v, --verbose           Enable verbose output
        --debug                 Enable debug output
        --timing                Show timing statitiscs
        -i, --interval <sec>    Display interval in seconds

    Output:
        -A, --ascii             ASCII output
        -U, --unicode           Unicode output
        -B, --braille           Braille output

    Plot type:
        scatter                 Add a scatter plot
        line                    Add a line/curve plot
        bar                     Add a bar plot

    Plot data source:
        -R, --read <file>       Read file to the end, each line is a record
        -F, --follow <file>     Read file waiting for more, each line is a record
        -P, --poll <file>       Read file at interval, each read is one record
        -X, --exec <cmd>        Run command, each line is a record
        -W, --watch <cmd>       Run command at interval, each read is one record

    Data source parsing:
        -p, --position <y-pos|x-pos,y-pos>
                                Find numbers in input line, pick 1 or 2 positions for X and Y values

        -r, --regex <regex>     Regex to match numbers from input line
        -l, --limit <count>     How many historical values to retain for plotting

    Plot modifiers:
        -c, --color <color>     Set plot color (1..255)
        -i, --interval <sec>    Set sampling interval in seconds

EXAMPLES

    blot --braille \
        line    --color 10 --read x_y1_values -p 1,2 \
        scatter --color 11 --read x_y2_values -p 1,2

    blot --braille \
        scatter --color 11 --read y_values \
        line    --color 10 --exec 'seq 1 100'

    blot --braille \
        line --poll /proc/loadavg --position 1 \
        line --poll /proc/loadavg --position 2 \
        line --poll /proc/loadavg --position 3
First, pick a plotting mode, there are 3 choices: scatter, line, and bar.
Multiple plots can be overlayed.
Each plot needs to get data from a file or process, and there are 5 options:
--read <file>to read lines data from a file, stop at the end.--follow <file>to read lines data from a file, but wait for more data (Ctrl-Cto stop).--poll <file>to poll a file (like/sysor/procfiles), at some interval, and plot the results.--exec <cmd>to run a program that will give us data to plot on successive lines.--watch <cmd>to run a program that outputs one number per execution, which will be accumulate and plotted.
Let’s look at some examples.
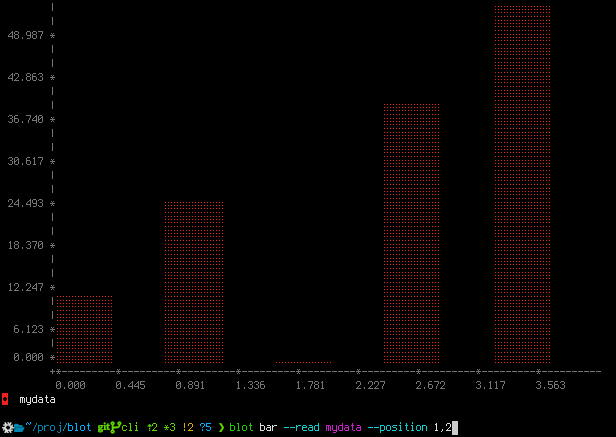
plot numbers from a file (read file mode)
Let’s say we have a file that contains some X,Y pairs…
0 10
1 25
2 0
3 40
4 55
We can plot this using…
❯ blot bar --read mydata --position 1,2
The values 1 and 2 are positions in each line where blot will find the X,Y coordinates.
plot numbers from a log file (follow file mode)
Let’s say that we have a log file, with some magnitude values. Let’s just make something up with a script…
#!/usr/bin/env bash
while true ; do
    echo $RANDOM
    sleep 1
done > mydata
While the above is running, we can plot the data being generated…
❯ blot line --follow mydata
The file contains only one number per line, and blot will use the line number as the Y coordinate.
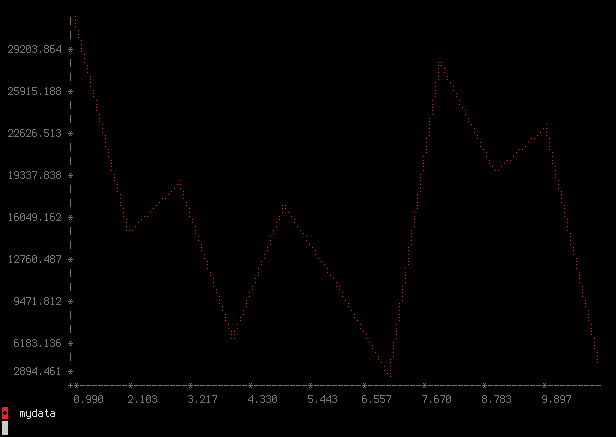
Plot will update continuously, until Ctrl-C is used to stop.
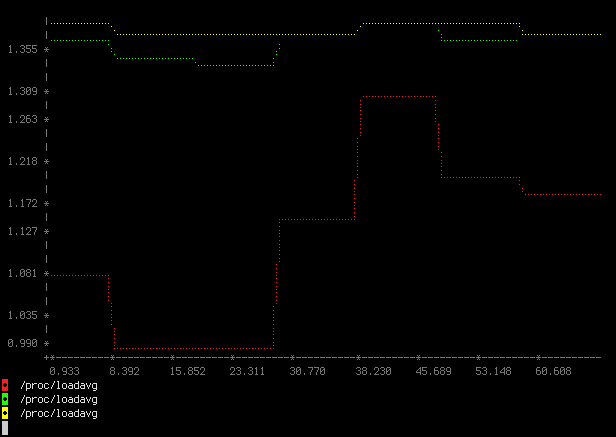
plot the system load (poll file mode)
Recall that /proc/loadavg has 3 load values (1,5,15 minutes). We can plot them…
❯ blot line --poll /proc/loadavg --position 1 --interval 0.5 \
       line --poll /proc/loadavg --position 2 \
       line --poll /proc/loadavg --position 3
plot temperature over time
Here is a script I use to plot the highest 7 temperatures in the system:
INPUTS=( $( grep . /sys/class/hwmon/hwmon*/temp*_input | sort -t : -k 2 -n -r | head -n 7 | cut -d : -f 1 ) )
blot --timing --braille $( for f in "${INPUTS[@]}" ; do echo "line --poll $f --interval 0.5 --limit 1000" ; done )

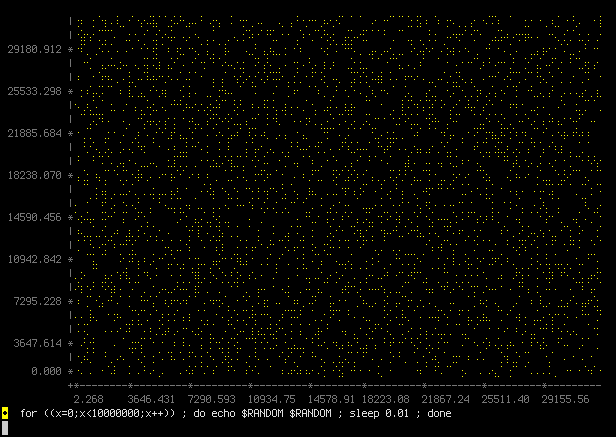
read X,Y from command line (exec mode)
Here is a cool way to test your random number generator, generate two consecutive numbers and plot them against one another.
❯ blot scatter --exec 'for ((x=0;x<10000000;x++)) ; do echo $RANDOM $RANDOM ; done' --position 1,2
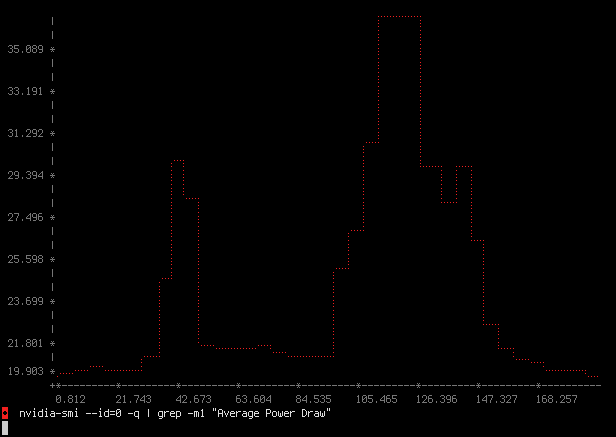
plot power draw of a GPU (watch mode)
The Nvidia graphics tools provide a system management interface CLI, named nvidia-smi.
If we wanted to plot the average power draw, then we could do this…
blot --timing line --watch 'nvidia-smi --id=0 -q | grep -m1 "Average Power Draw"' --interval 0.1
Source code examples
blot is being used in other projects as a library, and it comes with many
examples for the C and C++ usage.
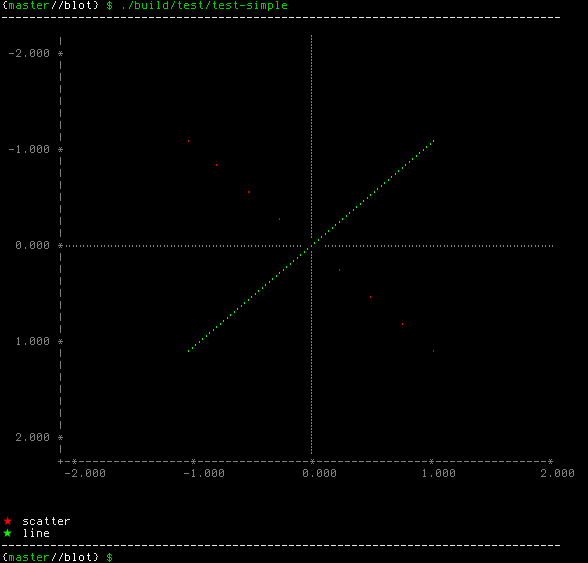
Generated from simple.c (see also simple.cpp for C++ wrapper usage)
./build/examples/c/c-simple
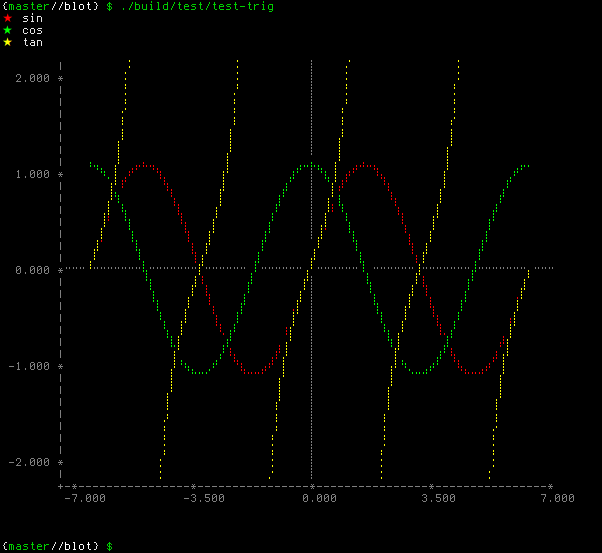
Generated from trig.c (see also trig.cpp for C++ wrapper usage)
./build/examples/c/c-trig
Missing features
- different plotting modes like histograms (currently only plots line/scatter/bar)
- improve axis line and numbering (currently not very accurate)
- add axis labels and minor ticks (configurable)
- draw origin lines and minor tick lines (configurable)
- better 256 colour support
Ideas:
Allow for swapping data from layer to allow for even faster plotting (allow blot to reuse existing allocated structures)
- create a figure
- all
blot_figure_scattermultiple times, have it return theblot_layer - call
blot_figure_renderandblot_screen_get_text - then use
blot_layer_new_datato swap the data - repeat from step (3)
Similar projects
- plotille - Python, “plot, scatter plots and histograms in the terminal using braille dots”
- Tables-and-Graphs - “C++ Console Table and Graph/Plot Libraries”